The data are the displacement of an elastic medium under a small compression. Only one component of the displacement is observed.
Our contribution: We have proposed an algorithm to estimate the spatial distribution of Young's modulus. It relies on ideas issued from the field of data assimilation and optimal control. The cost function is minimized using a Gauss-Newton algorithm, using direct and adjoint differentiation.
|
|
|
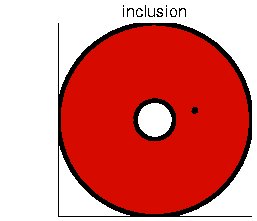
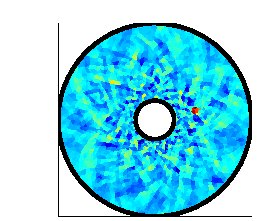
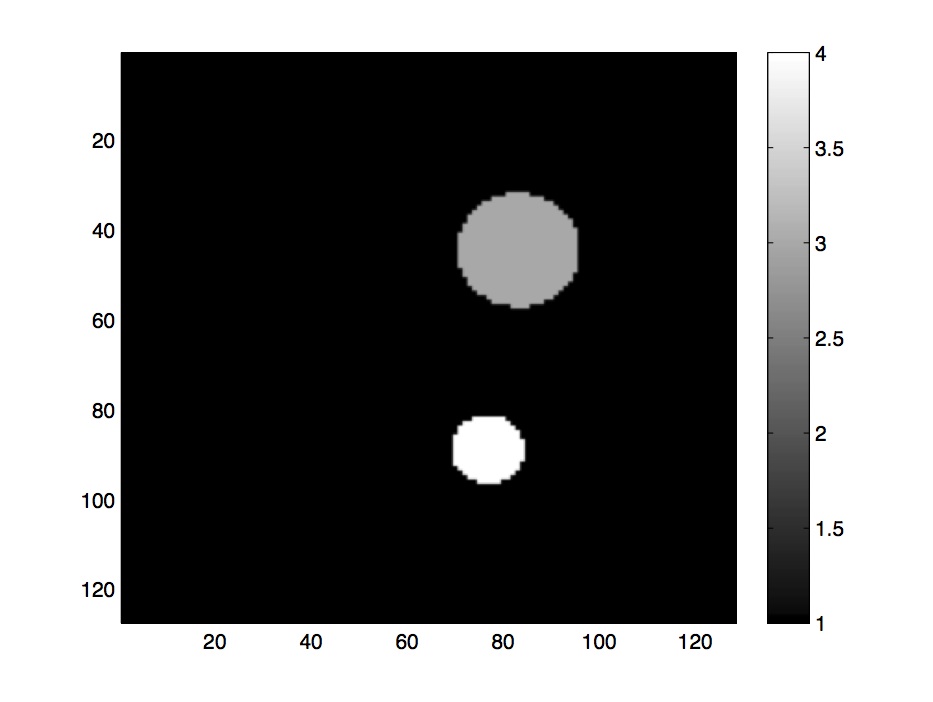
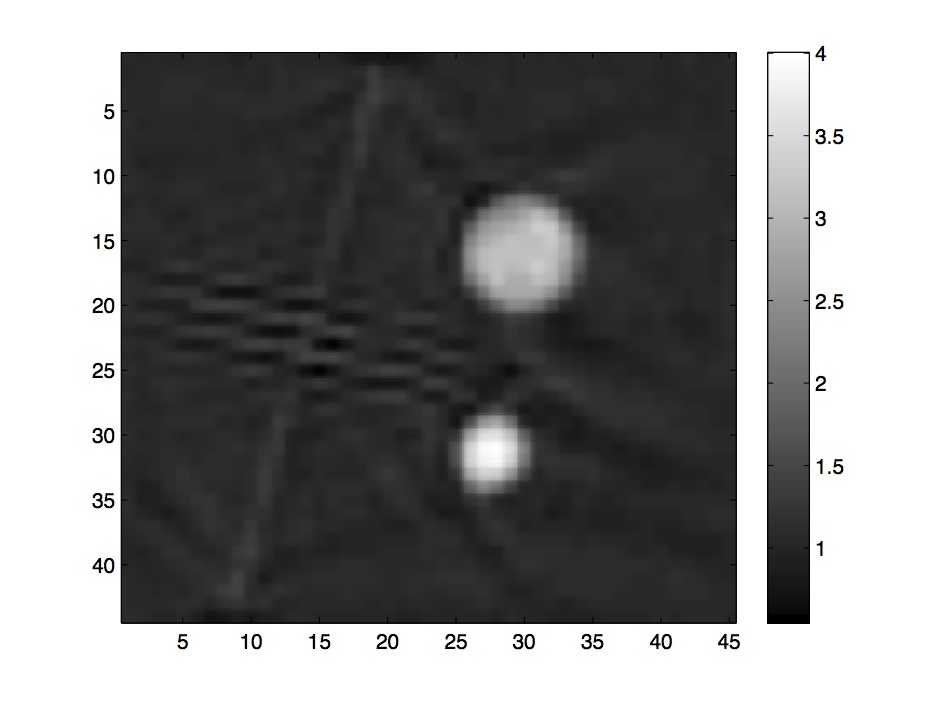
Left: true inclusion. Right: reconstructed Young's modulus (2% noise added) |
|
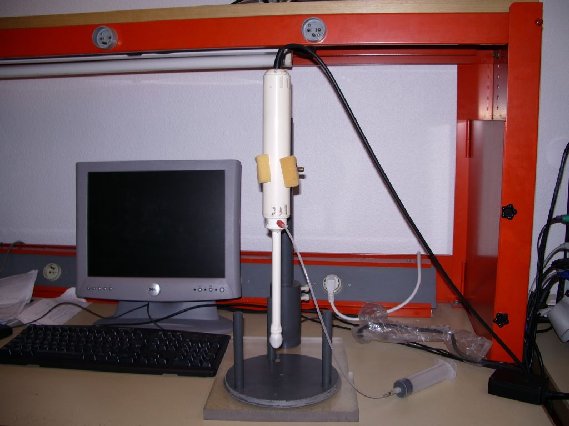
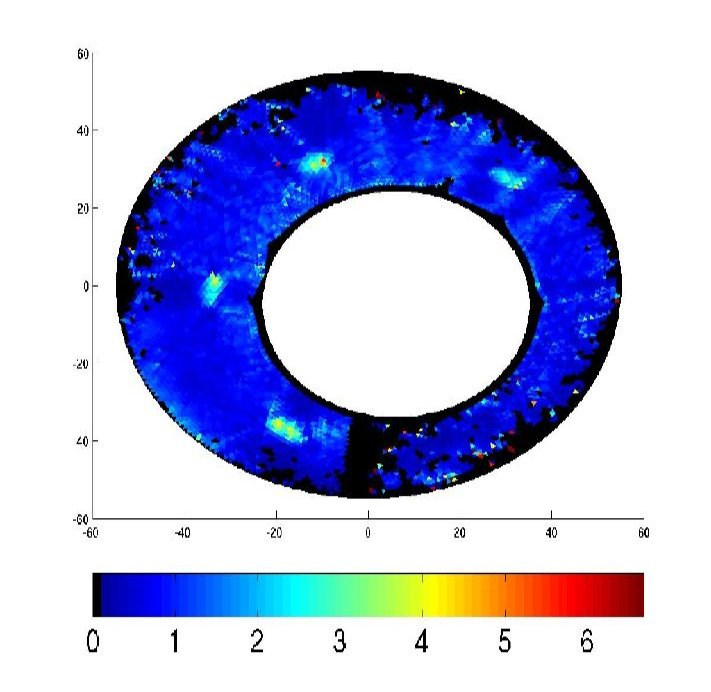
Elastographic data are obtained using a modified endorectal probe. This allows to estimate radial displacements of a hollow cylindrical agar phantom. The phantom contains 6 inclusions of widths ranging from 0.55 to 2.6mm (phantom not displayed on the picture). The inversion procedure allows to localize 4 out of 6 inclusions, and provides a quantitative estimation of the relative stiffness of the inclusions.
|
|
|
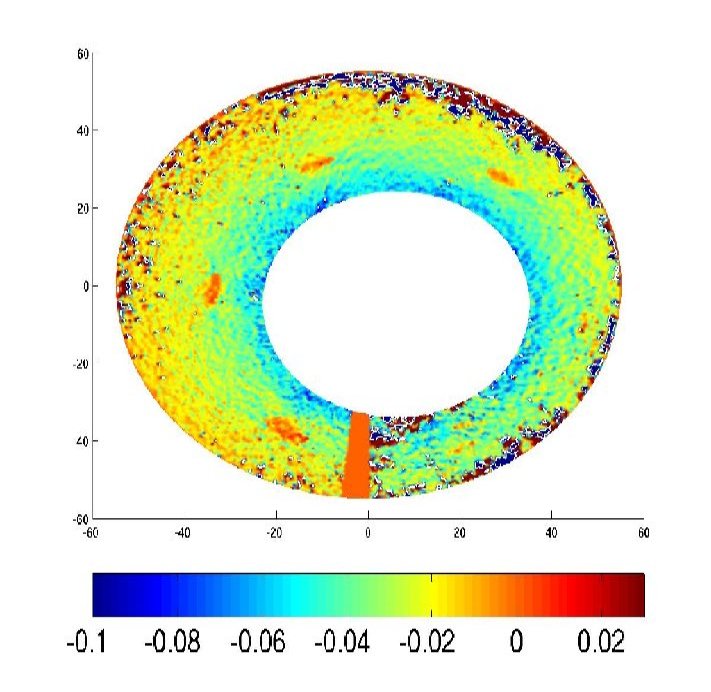
Left: experimental setup; center: strain elastogram (in %); right: reconstructed Young's modulus (relative units) |
||
More details:
The scalar wave equation describes the propagation of a shear wave in an incompressible medium.
Our contribution: We proposed a variational data assimilation method to reconstruct the velocity of the wave. This algorithm proved to be relatively robust to noise.
|

|
|
|
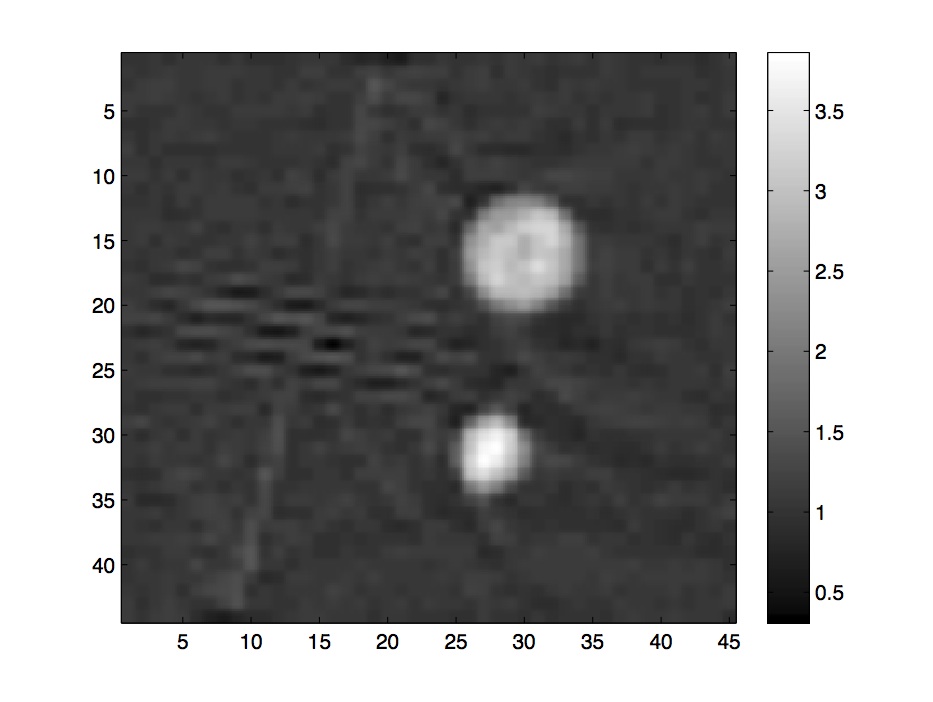
From left to right: true velocity; reconstructed velocity with 5% added noise; 10% added noise; 20% added noise. |
|||
More details