

Mimic nice tikz drawings with vector graphics in Inkscape
We review a method of reproducing tikz drawings in Inkscape, without the hassle of dealing with control points coordinates, nodes, and all that jazz.
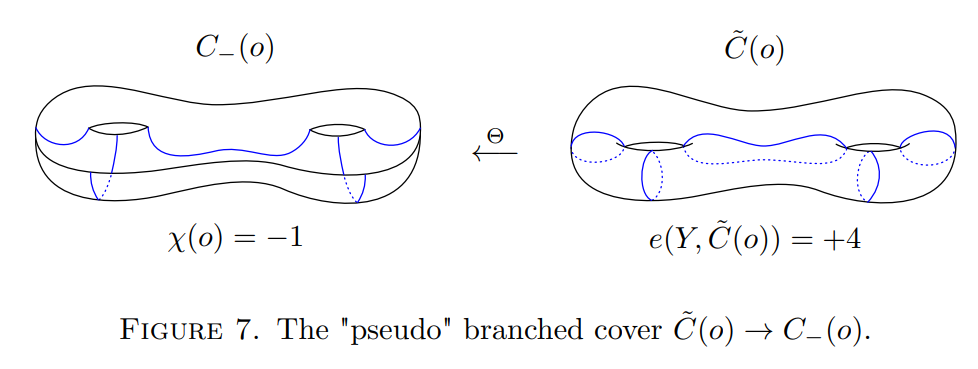
This kind of drawing is easy to do in Inkscape, and painful in tikz:
I will explain the setup of how to reproduce such drawings easily. Inkscape is a free, open-source, vector graphics software, available for Windows, Linux and Mac.
The setup
Before anything, make sure you have loaded the following two packages: \usepackage{caption,subcaption}.
First, let's talk about the setup: you need to know the maximum width you have available for an image. This measurement can be obtained from your \(\LaTeX\) document by use of the layout package:
\usepackage{layout}

\begin{document}
\layout
This will produce this kind of output:
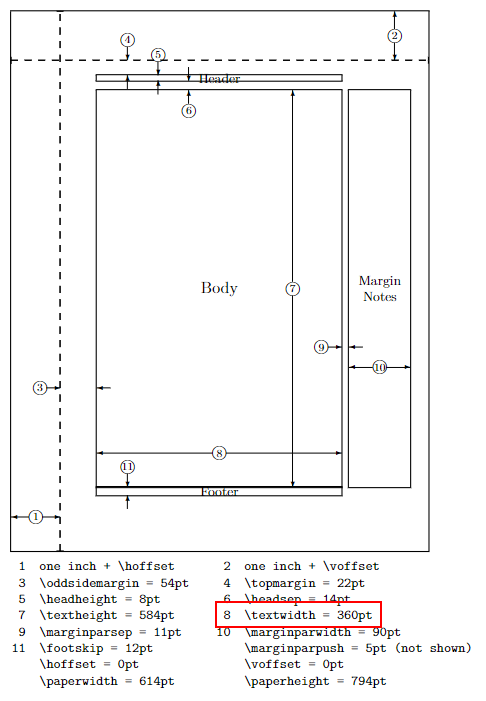
The line you are interested in is the one mentioning the value of \textwidth. In my case, it is 360pt. note that the geometry package allows for easy management of the different measurements of the document. Next, open up Inkscape. Navigate to File > Document properties.
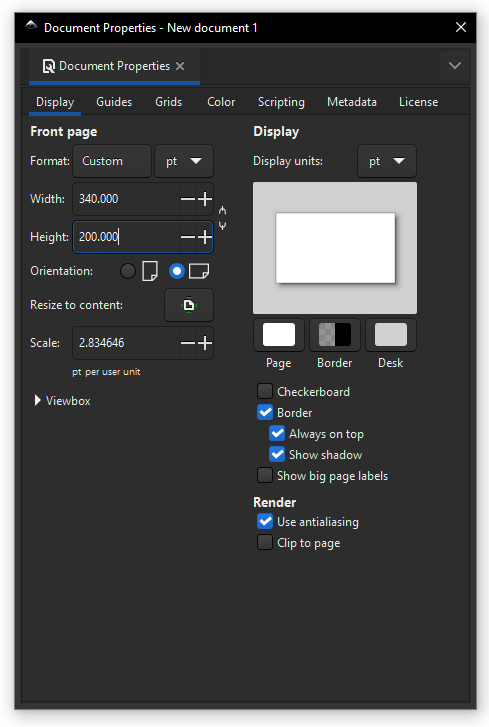
Make sure that the units is in points, and choose the size according to your \textwidth. In my case, I chose a slightly smaller width to be on the safe side. Height is totally dependant on the format of your image. You can now close this window, and you can start drawing!
Drawing in Inkscape
I will not go over a full-scale tutorial, there are lots of better ones already available. However, here are some useful advices I gathered over the time:
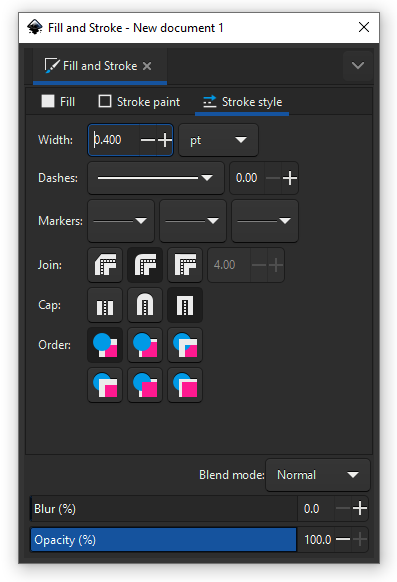
- Tikz has a default stroke width of 0.4pt, so make sure you do the same.
- The so-called Pencil tool, whose description reads Draw freehand lines (P), is convenient to start from a crude hand-drawn curve. It will smooth it, depending on the value of 'Smoothing' (defaulting to 60.00), and you can later edit the Bézier control points to fine-tune the path.
- You can always paste a PNG image, and have it on 50% opacity in the background, to serve as guidelines.
- In the 'Align and Distribute' menu, you can make sure the drawing is aligned at least horizontally to the center of the page, so that it also appears centered in the actual document.
- If you have a not-so-blurry PNG image, you can import it and directly convert it to vector graphics via the 'Trace Bitmap' menu. You will also be able to further edit it.
Once your image is completed, Inkscape will save in an editable format, a.k.a. SVG. You need to export it to a PDF "image":
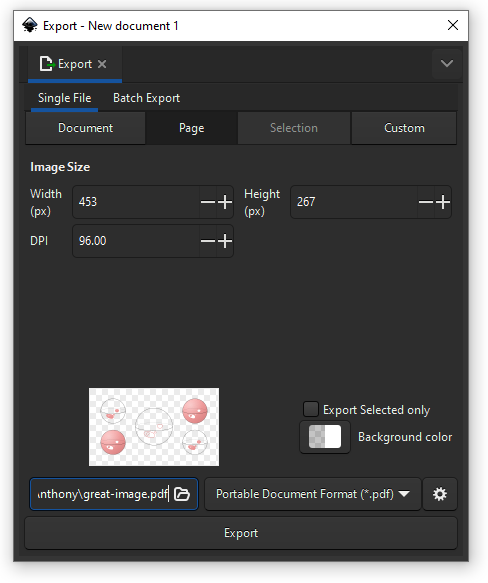
Including images in the actual document
Once your image is exported as a PDF, you may want to add legend to it, equations, labels or whatnot. This is where you can reunite with tikz! It is preferrable to avoid any text objects in the image, as embedded fonts can cause some problems to some journals. This is an example of how you can achieve text to produce the image in the introduction of this note:
\begin{figure}[ht]
    \centering
    \begin{tikzpicture}
        \node[inner sep=0pt] at (0,0) {\includegraphics{img/pdf/Fig7.pdf}};
        \node at (0,0) {$\overset{\Theta}{\longleftarrow}$};
        \node at (-3,-1.1) {$\chi(o)=-1$};
        \node at (3,-1.1) {$e(Y,\tilde{C}(o))=+4$};
        \node at (-3,1.1) {$C_-(o)$};
        \node at (3,1.1) {$\tilde{C}(o)$};
    \end{tikzpicture}
    \caption{The "pseudo" branched cover $\tilde{C}(o)\to C_-(o)$.}
\end{figure}
Subfigures?
If you want to have a figure made of several subfigures, you need to be more careful. In your \textwidth measurement, you need to divide by the number of subfigures you want, and add some bleed. The subcaption package inserts some \hspace between figures. In my case of 360pt, I will therefore default to figures of width 110pt to stay on the safe side. To include the images, here is an example of a figure and its corresponding code:
\begin{figure}[ht]
\centering
\begin{subfigure}[b]{.3\textwidth}
\centering
\includegraphics{img/nodal-singularity.pdf}
\caption{}
\end{subfigure}
\begin{subfigure}[b]{.3\textwidth}
\centering
\includegraphics{img/tangency-singularity.pdf}
\caption{}
\end{subfigure}
\begin{subfigure}[b]{.3\textwidth}
\centering
\includegraphics{img/cuspidal-singularity.pdf}
\caption{}
\end{subfigure}
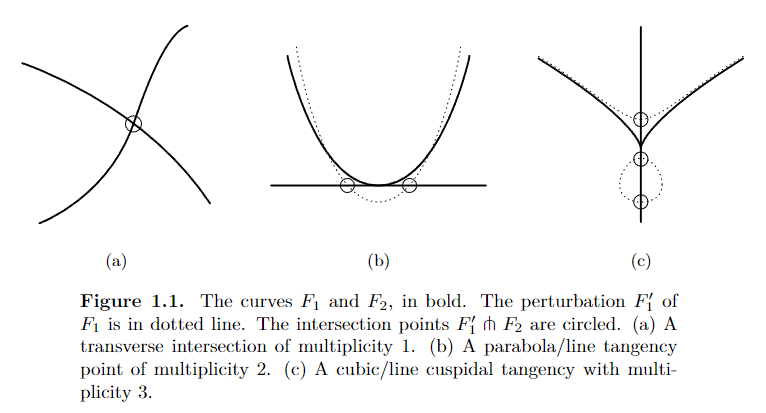
\caption{The curves $F_1$ and $F_2$, in bold. The perturbation $F_1'$ of $F_1$ is in dotted line. The intersection points $F_1'\tcap F_2$ are circled. (a) A transverse intersection of multiplicity $1$. (b) A parabola/line tangency point of multiplicity $2$. (c) A cubic/line cuspidal tangency with multiplicity $3$.}
\label{fig:bezout-singularities}
\end{figure}Note that if you do not need any form of legend, labels, etc., then it is unnecessary to put the image inside a node of a tikzpicture environmenent.